
Organizations are working harder than ever to deliver sustainable, profitable growth through technology. And the role of the CFO is being redefined to include leadership in technology strategy and digital transformation. To be truly strategic, accounts payable functions must quickly generate sharp business analysis and advice impossible with manual, disconnected finance processes. Process automation allows CFOs to standardize and centralize core operations, actively driving visibility, efficiency and consistency to support a strategic advantage.
The most recent American Productivity & Quality Center (APQC) research, Blueprint For Success: Accounts Payable (Second Edition, 2018), outlines four key performance indicators which clearly illustrate the value and strategic advantages of AP automation by standardizing and centralizing common AP processes. Here’s a top-line recap of the findings.
In order to position and maintain accounts payable as a strategic business unit, it’s important that your organization monitor a balanced set of KPIs. APQC recommends tracking the following four high-level KPIs for AP:
- Cost:Total cost to perform the AP process per invoice processed
- Productivity:Number of invoices processed per AP full-time equivalent
- Efficiency:Number of AP FTEs per $1 billion in revenue
- Cycle time:Number of days from receipt of invoice until payment is transmitted
The comparison between top- and bottom-performing organizations is striking; the research shows that bottom performers operate at a HUGE competitive disadvantage.
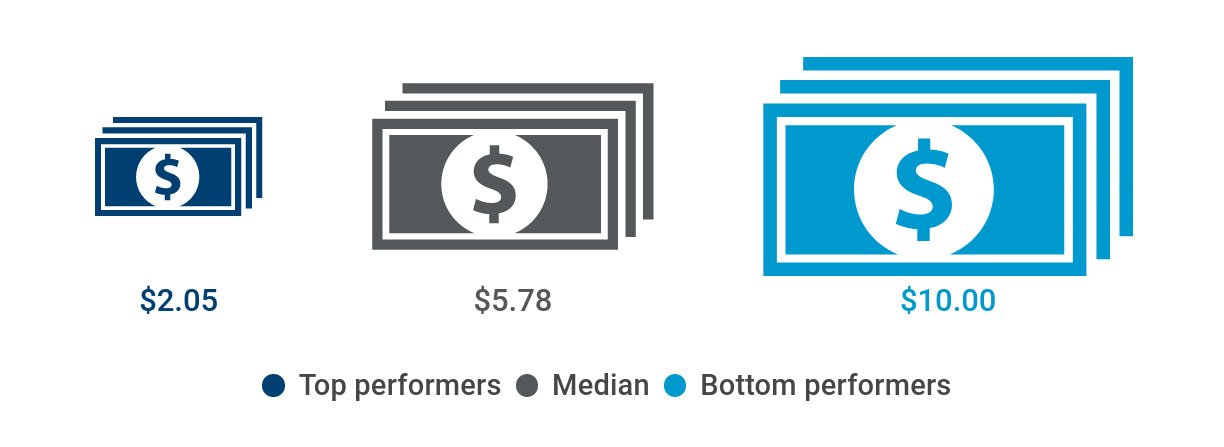
KPI 1: Cost
The performance metric that often attracts the most focus for AP is cost per invoice processed. Whether your organization has centralized, decentralized or a financial shared service center model, everybody cares about process cost.
Among the surveyed organizations, bottom performers incur a process cost of $10 or more per invoice processed. Top performers, on the other hand, can do the same task at a cost of $2.05 per invoice or less five times less than the organizations in the bottom quartile. At the median are the organizations spending $5.78 to process an invoice, which is more than double the process cost of top performers.
An interesting note in the research found that only about one in five (organizations) have standardized their AP processes enterprise wide. By gaining the ability to define, document and standardize common finance processes, your organization can begin to reduce costs and increase process efficiencies.
- According to APQC’s research, top selection criteria for processes to automate include: The number of repetitive manual tasks and activities;
- Potential cost savings from automation;
- The categorical nature of the process (e.g., transactional versus strategic)
- The frequency of occurrence
Ideally, your organization should look to automate all repetitive and routine tasks in AP, such as scanning invoice data, matching invoice and purchase orders, maintaining vendor master data, and even components of reporting and analyzing AP data.
In addition to the cost benefits, automating AP transactional activities and repetitive tasks as much as possible, can help track and audit the entire process, and ease oversight of internal control points by prompting authorizations, pinpointing possible fraud, and detecting unproductive activities.
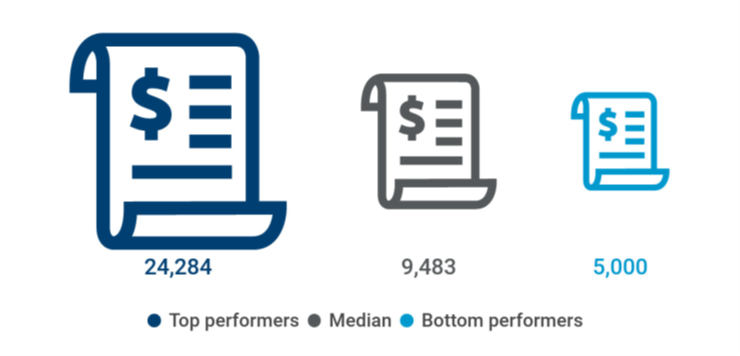
KPI 2: Productivity
Productivity KPIs are also important to examine when evaluating AP performance as high levels of AP staff productivity can lower costs and boost efficiency.
The graphic below shows the number of invoices processed per AP FTE for top, median, and bottom performers in the APQC OSB database. Based on an N size of almost 2,000, top performers are almost five times more productive than bottom performers at processing invoices.
One area that makes a critical difference in the number of invoices processed per AP FTE is manual keying of invoice line items. APQC finds that those with non-manual invoice entry have significantly higher productivity and efficiency levels than those with more manual AP processes. The median productivity level for those who manually key in less than 25 percent of their invoice line items is almost twice that per AP FTE as compared to those who manually key in 75 percent or more of their invoice line items.
APQC’s research shows that the leading barrier to finance process improvement is employees’ already demanding workload requirements. By leveraging AP automation, your organization can gain the ability to leverage AP professionals for high-value activities that require human interaction, such as oversight and monitoring, audit and control, data and context synthesis and stakeholder decision support. Automation also provides your AP professionals with bandwidth to proactively track and improve performance.
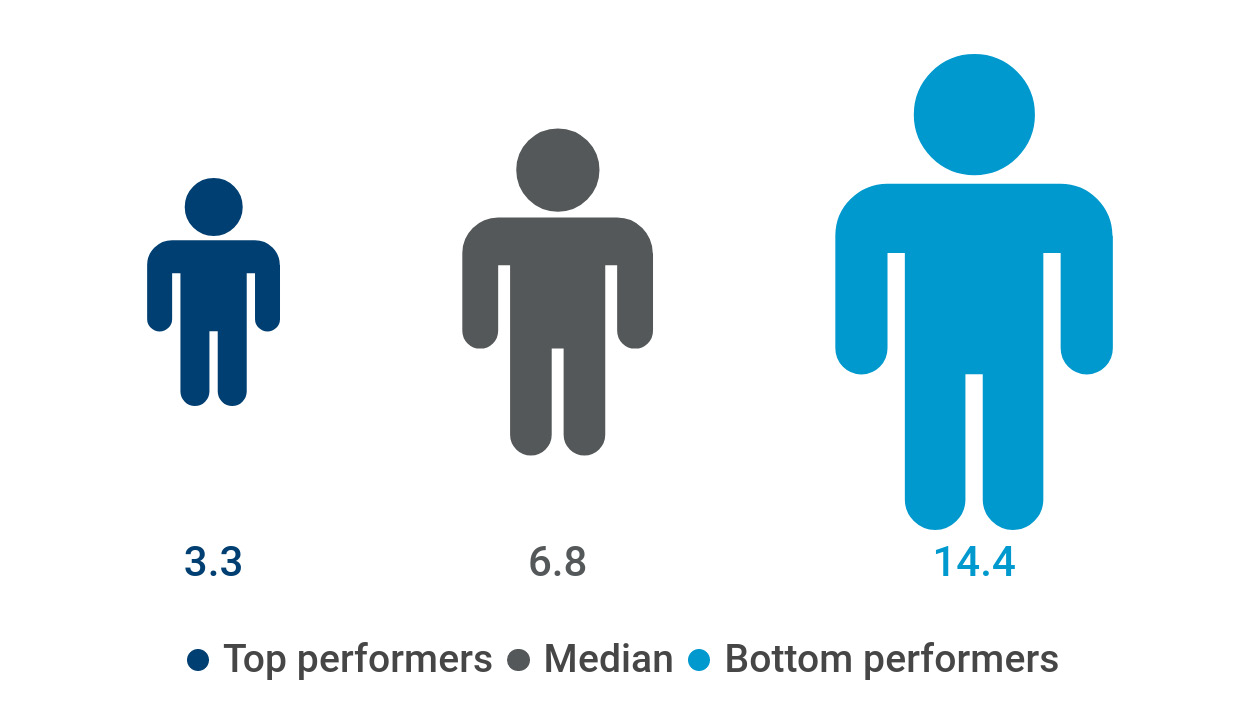
KPI 3: Efficiency
Efficiency as measured by the number of AP FTEs per $1 billion in revenue is a key performance indicator for the AP process. Since labor cost for AP represents the lion’s share of total AP process costs, this KPI becomes vital for your organization to evaluate options for role restructuring and automation.
Keeping costs and staffing levels in line means carefully adjusting the number of AP employees with the expected level of work that must be done on an annual basis. As shown below, bottom performers need more than four times as many FTEs to perform the AP process per $1 billion in revenue as top performers.
Major changes to the AP process whether due to automation, new technologies, or process standardization and improvement require implementing a holistic change management approach to support changing AP roles. APQC recommends supporting AP change initiatives with leader engagement, employee involvement, regular communication, training, and performance management.
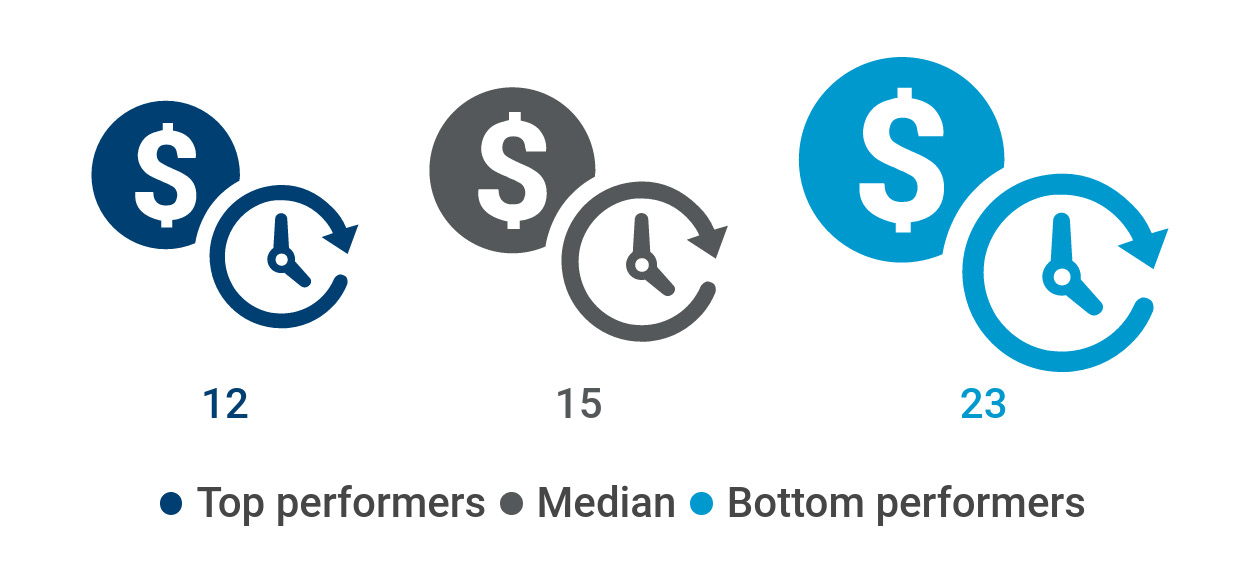
KPI 4: Cycle Time
Cycle time KPIs are the fourth important component of a balanced scorecard of measures for any process. Cycle time is important for AP for multiple reasons, including:
- Contracts that require organizations to pay suppliers on time
- Maintaining good relationships with suppliers and safeguarding your brand reputation in the marketplace
- Ensuring your organization takes advantage of all available early-pay discounts offered by suppliers
According to APQC’s benchmarks, top performers take half as many days to process invoices, from receipt to payment. Even reaching median benchmarks can help bottom performers shave a week off of their cycle time. As shown below, bottom performers take nearly twice the total time as top performers to receive, process and pay an invoice.
An added element to cost, productivity, efficiency and cycle time KPI benchmarking is ultimately the people, practices, processes, and technology your organization employs in your digital transformation journey. As noted, the role of the CFO is being redefined to include leadership in technology strategy and digital transformation, which begins with leading the charge for broader process transformation and ultimately, transformation of the business itself.
Every organization can use this process-based framework for evaluating and improving AP processes using core KPIs. They provide a foundation for AP functions to improve and, when appropriate, automate processes, as well as better utilize AP professionals’ skills to advance their proficiency in analytics, reporting and decision support, and process improvement.
If you would like to know more about how to begin your AP automation initiative, Laserfiche can show you where and how to start.
This article was originally published on the Laserfiche Blog. Laserfiche is a leading SaaS provider of intelligent content management and business process automation.